What is a PivotTable?
Within Microsoft Excel, A PivotTable is a table of grouped values that summarises individual items into more of an extensive view.
This summary can include sums, averages, or other statistics that the table will group together based on a chosen function.
A PivotTable is a technique in data processing to analyse patterns and trends in your data. It allows you to calculate and summarise your data in a way that makes it so simple to work with.
They arrange or “pivot” data around a subset of functions chosen by the user to draw attention to the most useful data.
These tables are also based on a live set of data, so any updates to the data will be reflected in the pivot.
How are PivotTables Useful?
By taking data in its raw format, PivotTables can quickly and easily give simple to read analytical data that can help with decision making.
The same set of data can be summarised in multiple PivotTables for even quicker access to information.
The user has control over:
- Filters
- Rows
- Columns
- Values (such as SUM, AVERAGE, COUNT)
PivotTable Use Cases
Let’s take this example of Works Orders from a Manufacturing environment. Showing the users each order, where it’s made and how much it costs in labour and parts.
However, It is very difficult to see some overall figures or make some clear decisions from this.

By simply building a PivotTable we have so much control over what we wish to see.
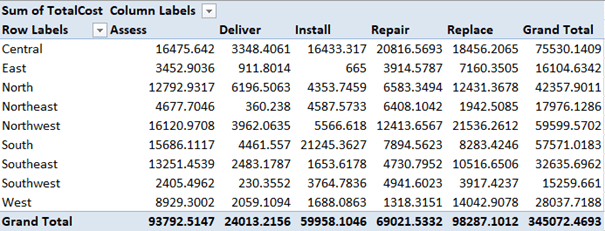
This is a summary of the total cost per service by region.

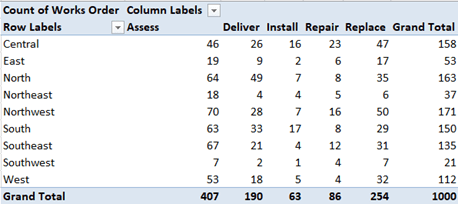
This uses the same data and now returns a count of each service by region.

And finally – the number of labour hours each technician is predicted to spend in each region.

Discover our PivotTable related Excel Educution videos below
A Quick Guide to PivotTables
An Advanced Guide to PivotTables
How to Use PivotTables and Slicers
Discover all of our Excel Education videos.


